Eid Mubarak
May Allah accept your prayers.
Read MoreDerivatives Market Summary
Find out about the Derivatives market on the Saudi ExchangeFund Market Summary
View information on CEFs, REITs and Mutual Funds Web Content Viewer
Actions
MarketSummaryPortlet
Actions
Market Summary Home V2
Actions
Web Content Viewer
Actions
MarketSummaryPortlet
Actions
Market Summary Home V2
Actions
 Market Closed
Value Traded (SAR) 8,195,028,835.55
Volume Traded 311,278,184
Market Cap (SAR MN) 10,784,320.11
Symbols Up 130
Symbols Down 90
Symbols Listed 234
Value Traded (SAR) 55,920,412.60
Volume Traded 3,994,687
Market Cap (SAR MN) 52,305.12
Symbols Up 33
Symbols Down 27
Symbols Listed 85
| Instrument Type | Volume Traded | Open Interest |
|---|---|---|
| Index Futures | 0 | 0 |
| Single Stock Futures | 0 | 200 |
| Single Stock Options | 0 | 18 |
| Underlying | Volume Traded | Open Interest |
|---|---|---|
| MT30 Index Futures | 0 | 0 |
| Underlying | Volume Traded | Open Interest |
|---|---|---|
| ALRAJHI | 0 | 0 |
| ALINMA | 0 | 0 |
| SNB | 0 | 0 |
| MAADEN | 0 | 0 |
| SABIC | 0 | 0 |
| SAUDI ARAMCO | 0 | 200 |
| ALMARAI | 0 | 0 |
| SAUDI KAYAN | 0 | 0 |
| SAUDI ELECTRICITY | 0 | 0 |
| STC | 0 | 0 |
Value Traded (SAR) 1,067,337,011.73
Nominal Value Traded (SAR) 1,206,533,000
Total size of issuances (SAR MN) 563,957.29
Up 4
Down 3
Sukuk & Bonds Listed 71
Value Traded (SAR) 20,435,008.85
Volume Traded 2,411,444
No. Of Trades 6,582
Listed Funds 19
| ETFs | Price | % change | iNav Per unit |
|---|---|---|---|
| YAQEEN 30 | 52.40 | -0.76% | 0.00 |
| YAQEEN PETROCHEMICAL | 32.08 | -0.62% | 0.00 |
| SAB MT30 | 47.65 | 0.73% | 0.00 |
| ALBILAD SUKUK | 8.02 | -0.37% | 0.00 |
| ALINMA SUKUK | 10.49 | -0.19% | 0.00 |
| ALBILAD GOLD | 12.84 | 0.0% | 0.00 |
| ALBILAD MSCI | 11.35 | -0.87% | 0.00 |
| ALBILAD US TECH | 14.82 | -1.98% | 0.00 |
| ALBILAD SAUDI GROWTH | 10.89 | -0.37% | 0.00 |
Value Traded (SAR) 1,770,271.80
Volume Traded 138,788
No. Of Trades 509
Listed Funds 9
| CEFs | Price | % change | Volume Traded |
|---|---|---|---|
| Alkhabeer Income | 6.89 | 0.15% | 38,170 |
| ALKHABEER GROWTH AND INCOME | 8.48 | -2.42% | 456,060 |
Value Traded (SAR) 4,103,182.44
Volume Traded 494,230
No. Of Trades 1,048
Listed Funds 2
Value Traded (SAR)
Volume Traded
Open
No. Of Trades
Value Traded (SAR)
Volume Traded
Open
No. Of Trades
Value Traded (SAR)
Volume Traded
Open
No. Of Trades
Value Traded (SAR)
Volume Traded
Open
No. Of Trades
Web Content Viewer
Actions
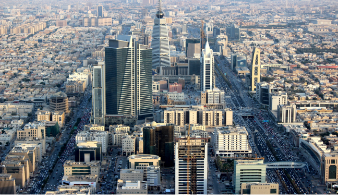
The Saudi Exchange is shaping what comes next in capital market development in Saudi Arabia, protecting market participants and offering tailored services that are attractive to domestic and international stakeholders.
Market Capitalization: SAR 10.93 trillion (USD 2.91 trillion) as the end of March 2024
Average Daily Value Traded: SAR 9.23 billion (USD 2.46 billion) for March 2024.
Global ranking by market cap 9th largest in the world as the end of March 2024
Total QFI Holding: SAR 332.9 billion (USD 88.78 billion) as the end of March 2024.
Web Content Viewer
Actions
Company in Focus offers exclusive access to the senior leadership of listed companies and highlights what made their listing experience memorable.
For insights into the listing journey of recently listed companies, watch the interviews below. Company in Focus offers exclusive access to the senior leadership of listed companies and highlights what made their listing experience memorable.
Web Content Viewer
Actions
Discover Invest Wisely – the Saudi Exchange's information platform designed to cater
for the needs of those interested in investment.
 Web Content Viewer
Actions
Web Content Viewer
Actions
For further information, please get in touch with us:
E: csc@saudiexchange.sa
P: (+966) 92000 1919
SaudiExchangeNewsletterPortlet
Actions
Web Content Viewer
Actions
Download our Saudi Exchange mobile app and stay connected with the latest news and happenings on the Exchange.


 Web Content Viewer
Actions
Web Content Viewer
Actions
The parent company for the Saudi Exchange and other subsidiaries Edaa, Muqassa and Wamid.
The Securities Depository Center for the Saudi market.
The Securities Clearing Center for the Saudi market.
Innovation-focused solutions for the Saudi capital market and beyond.