Eid Mubarak
May Allah accept your prayers.
Read More???theme.topnav.derivative.right.info???
???theme.topnav.derivative.right.desc??????theme.topnav.fund.right.info???
???theme.topnav.fund.right.desc??? Web İçeriği Görüntüleyicisi
İşlemler
MarketSummaryPortlet
İşlemler
Market Summary Home V2
İşlemler
Web İçeriği Görüntüleyicisi
İşlemler
MarketSummaryPortlet
İşlemler
Market Summary Home V2
İşlemler
 Market Open - Trading
Value Traded (SAR) 4,051,488,531.92
Volume Traded 146,040,964
Market Cap (SAR MN) 10,934,907.18
Symbols Up 64
Symbols Down 159
Symbols Listed 234
Value Traded (SAR) 16,969,979.43
Volume Traded 897,035
Market Cap (SAR MN) 51,991.99
Symbols Up 16
Symbols Down 28
Symbols Listed 85
| Instrument Type | Volume Traded | Open Interest |
|---|---|---|
| Index Futures | 0 | 0 |
| Single Stock Futures | 0 | 200 |
| Single Stock Options | 0 | 18 |
| Underlying | Volume Traded | Open Interest |
|---|---|---|
| MT30 Index Futures | 0 | 0 |
| Underlying | Volume Traded | Open Interest |
|---|---|---|
| ALRAJHI | 0 | 0 |
| ALINMA | 0 | 0 |
| SNB | 0 | 0 |
| MAADEN | 0 | 0 |
| SABIC | 0 | 0 |
| SAUDI ARAMCO | 0 | 200 |
| ALMARAI | 0 | 0 |
| SAUDI KAYAN | 0 | 0 |
| SAUDI ELECTRICITY | 0 | 0 |
| STC | 0 | 0 |
Value Traded (SAR) 1,489,858.83
Nominal Value Traded (SAR) 1,510,000
Total size of issuances (SAR MN) 563,957.29
Up 1
Down 3
Sukuk & Bonds Listed 71
Value Traded (SAR) 6,752,656.41
Volume Traded 914,257
No. Of Trades 3,219
Listed Funds 19
| ETFs | Price | % change | iNav Per unit |
|---|---|---|---|
| يقين 30 | 53.10 | -0.75% | 52.80 |
| يقين للبتروكيماويات | 33.20 | -1.63% | 32.91 |
| الأول إم تي 30 | 49.00 | -0.1% | 48.58 |
| صكوك البلاد | 8.01 | -0.37% | 8.02 |
| صكوك الإنماء | 10.50 | 0.0% | 10.51 |
| البلاد للذهب | 12.84 | 1.26% | 12.83 |
| البلاد إم إس سي آي | 11.48 | -1.54% | 11.47 |
| البلاد التقني الأمريكي | 15.06 | -1.95% | 15.06 |
| البلاد للنمو السعودي | 11.10 | -0.36% | 11.07 |
Value Traded (SAR) 1,048,631.51
Volume Traded 77,061
No. Of Trades 387
Listed Funds 9
| CEFs | Price | % change | Volume Traded |
|---|---|---|---|
| الخبير للدخل | 6.89 | -0.29% | 13,437 |
| الخبير للنمو والدخل | 8.75 | -0.57% | 22,387 |
Value Traded (SAR) 288,687.99
Volume Traded 35,824
No. Of Trades 222
Listed Funds 2
Value Traded (SAR)
Volume Traded
Open
No. Of Trades
Value Traded (SAR)
Volume Traded
Open
No. Of Trades
Value Traded (SAR)
Volume Traded
Open
No. Of Trades
Value Traded (SAR)
Volume Traded
Open
No. Of Trades
Web İçeriği Görüntüleyicisi
İşlemler
Web İçeriği Görüntüleyicisi
İşlemler
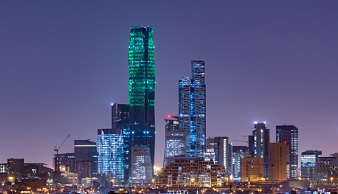
Interested in investing?
The Saudi Exchange is the largest and most liquid stock market in the MENA region with an array of investment opportunities.
Discover more
Are you an international investor?
Saudi Exchange has developed a content portal to support international investors interested in the Saudi capital market.
Discover more
Looking for the latest Saudi Exchange market data?
For insights into the weekly, monthly, quarterly and annual performance,visit our reports section.
Discover more
Becoming an issuer
Are you ready to take the next step and issue shares? Click below to know the rules, regulations and incentives available.
Discover more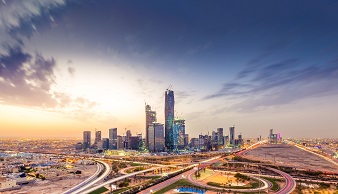
Curious if listing is the right next step?
Fill in the form by clicking the link below and a member of our team will contact you
Contact us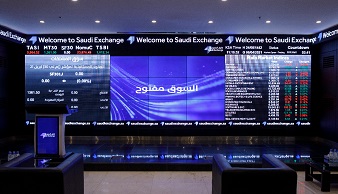
Does your company have an IR function?
For insights on Investor Relations best practices and guidance on how to build your IR function download our toolkit.
IR toolkit
Learn about Becoming a Qualified Foreign Investor
As a QFI, international investors have direct and consistent access to the Saudi capital market.
Discover more
View the latest Main Market summary
Today's market summary of the Main Market's top gainers, losers, and movers by volume and value.
Discover more
Read our latest Capital Markets report
Our capital markets report contains statistics and in-depth market perspectives presented by our leadership.
Discover more
Looking to become a Member of Saudi Exchange?
Saudi Exchange members benefit from advanced infrastructure, products and services.
Discover more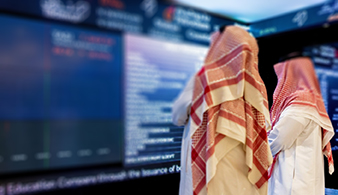
Members Directory
For a comprehensive list of both cash market and derivatives market members of the Saudi Exchange click on the link below.
Discover more
Useful Resources for Members
Looking for quick access to membership fees and relevant general information about the Saudi Exchange, click on the link below.
Discover more
Web İçeriği Görüntüleyicisi
İşlemler
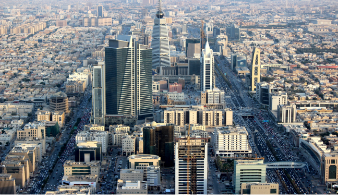
The Saudi Exchange is shaping what comes next in capital market development in Saudi Arabia, protecting market participants and offering tailored services that are attractive to domestic and international stakeholders.
Market Capitalization: SAR 10.93 trillion (USD 2.91 trillion) as the end of March 2024
Average Daily Value Traded: SAR 9.23 billion (USD 2.46 billion) for March 2024.
Global ranking by market cap 9th largest in the world as the end of March 2024
Total QFI Holding: SAR 332.9 billion (USD 88.78 billion) as the end of March 2024.
Web İçeriği Görüntüleyicisi
İşlemler
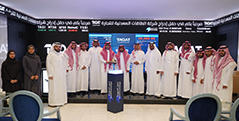
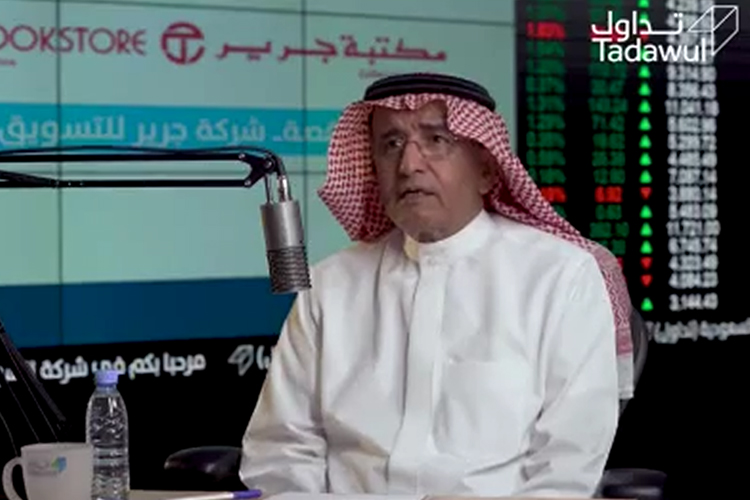
Company in Focus offers exclusive access to the senior leadership of listed companies and highlights what made their listing experience memorable.
For insights into the listing journey of recently listed companies, watch the interviews below. Company in Focus offers exclusive access to the senior leadership of listed companies and highlights what made their listing experience memorable.
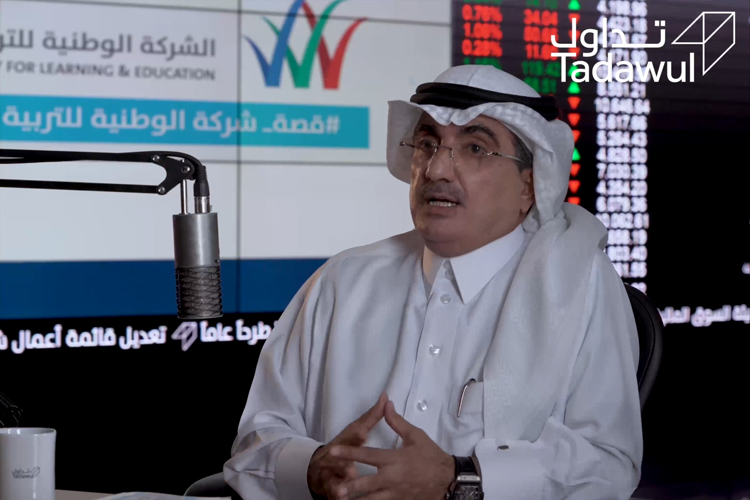
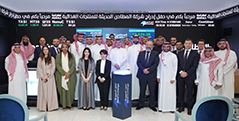
National Company for Learning and Education.
Mr. Khaled Mohammed Al-Khudair
Chairman of the Board of Directors
 Web İçeriği Görüntüleyicisi
İşlemler
Web İçeriği Görüntüleyicisi
İşlemler
Discover Invest Wisely – the Saudi Exchange's information platform designed to cater
for the needs of those interested in investment.
 Web İçeriği Görüntüleyicisi
İşlemler
Web İçeriği Görüntüleyicisi
İşlemler
For further information, please get in touch with us:
E: csc@saudiexchange.sa
P: (+966) 92000 1919
SaudiExchangeNewsletterPortlet
İşlemler
Web İçeriği Görüntüleyicisi
İşlemler
Download our Saudi Exchange mobile app and stay connected with the latest news and happenings on the Exchange.


 Web İçeriği Görüntüleyicisi
İşlemler
Web İçeriği Görüntüleyicisi
İşlemler
The parent company for the Saudi Exchange and other subsidiaries Edaa, Muqassa and Wamid.
The Securities Depository Center for the Saudi market.
The Securities Clearing Center for the Saudi market.
Innovation-focused solutions for the Saudi capital market and beyond.